A new method that automates the classification of progressive diabetic kidney disease, reducing variability and boosting precision, has been developed by researchers in the Jacobs School of Medicine and Biomedical Sciences at the University at Buffalo.
The advance is expected to minimize variability in diagnoses among pathologists. It may also lead to improvements in diagnosing other conditions, and eventually could allow clinicians to predict ahead of time which diabetic patients are at higher risk of developing kidney disease.
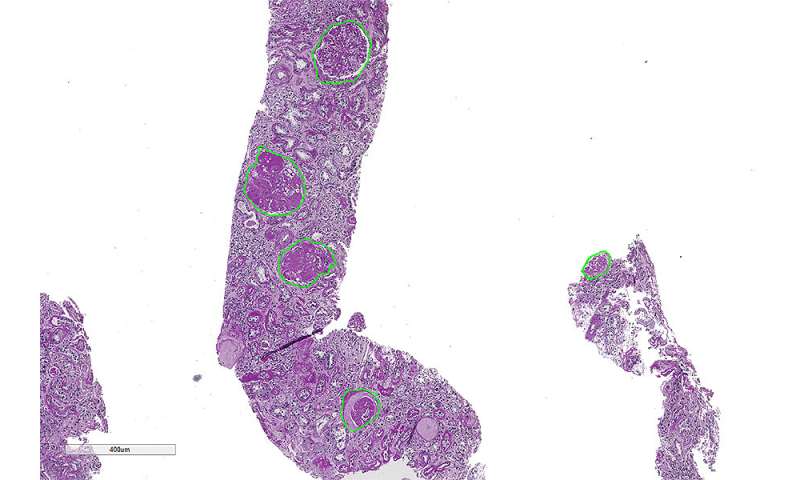
The new method functions as a kind of ‘digital pipeline’ that extracts and classifies important tissue structures in renal biopsies similar to the way that a human pathologist does.
Diagnosis with one click
“We have developed the first fully automated digital pipeline that, with one click, can diagnose what class of kidney disease a patient is in, without human intervention,” said Pinaki Sarder, Ph.D., assistant professor of pathology and anatomical sciences, who is senior author on the paper.
The diagnosis is based on the amount of disease-related changes observed in a renal biopsy.
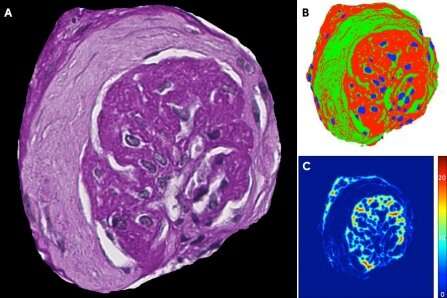
The focus is on a structure called the glomerulus, a sac-like bundle of capillaries that do first-line filtration of blood in the kidneys, and which is one of the most important structures in the kidney for monitoring disease progression.
“Glomeruli in diabetic patients exhibit progressive deposition of scar tissue, which eventually prevents the glomerulus from functioning correctly to filter the blood,” said Brandon Ginley, the paper’s first author and a doctoral candidate in the Department of Pathology and Anatomical Sciences at UB.
The researchers compared results from their automated method to those of three renal pathologists, one of whom is considered a “gold standard” pathologist. They explained that the automated method agreed with the gold standard pathologist about 50% of the time, suggesting that it has learned how to diagnose the cases (because it agrees with the human clinician part of the time), but also learned to develop its own opinion.
“If the method had learned to predict 100% the same as the gold standard pathologist, that would be bad, because that would mean that the method is learning too specifically to be like that specific doctor, who might have bias in their approach,” Ginley explained. “In this way, it is similar to a human diagnosis but still generalized without over-learning the bias of one particular doctor. The ultimate goal is to create a program that is free from the bias of any one particular doctor.”
Currently, pathologists classify a patient’s stage of diabetic nephropathy primarily by visually observing glomeruli and estimating the amount of damage.
“While the amount of damage constituting each class of the disease is clearly defined, the current assessment method is not fully quantitative and may be susceptible to personal bias,” said Ginley.

In order to improve and automate the precise classification of physical features in the glomeruli to better reflect disease progression, the researchers and colleagues created a set of computationally defined features that indicate the structural alterations in glomeruli that occur in diabetic nephropathy.
“These computationally defined quantifications are not susceptible to personal biases and thus can improve precision so that an objective diagnosis can be determined,” Ginley said.
Fixed measurements
Ginley explained that the digital features are based on fixed mathematical measurements, which cannot be influenced by the person doing the analysis.
“If one pathologist runs the algorithm on a piece of biopsied tissue and another pathologist runs the algorithm on the same piece of tissue, both of them should get exactly the same result,” he said. “A pathologist can then take the classification that the algorithm has assigned to the patient tissue and use it to better inform his final diagnosis.”
“The algorithm is also flexible enough to accept any number of new or different features, but the features I selected are specifically targeted to quantify important characteristics of diabetic disease, such as scarring of the glomeruli, which is reported in past clinical literature.
“Having a set of features hand-crafted by a human is beneficial because it increases the ability of a clinician to interpret why the algorithm made a particular decision,” Ginley said.
He noted that the human kidney can contain up to approximately 1 million glomeruli, but only a very small fraction of them are contained in a biopsy.
To get the most information out of these capillaries, the researchers created a type of neural network, algorithms designed to recognize complex patterns and relationships. The network they created is a recurrent neural network that is designed to work on a sequence of observed data, Ginley said.
“The recurrent neural network I designed takes the set of glomerular features as a sequence and outputs how it classifies the biopsy,” he said. “In this way, it examines the characteristics of each individual glomerulus in the sequence one by one, selecting what is the most important information from each one and determining how that information should be mapped to a final diagnosis, the same way pathologists do.”
Predicting more severe disease
The information gathered from renal biopsies using this method could eventually allow clinicians to predict which diabetic patients are likely to develop more severe renal disease.
“If we train the algorithm on two groups, people who have mild disease, and those who have severe disease, we can pull out the features associated with severe disease. Then we can use those features in the future to predict which patients may develop severe disease later in life,” Ginley said.
Source: University at Buffalo

